Rocklin, CA · Commercial & Field Service Business Systems

Data Visualization
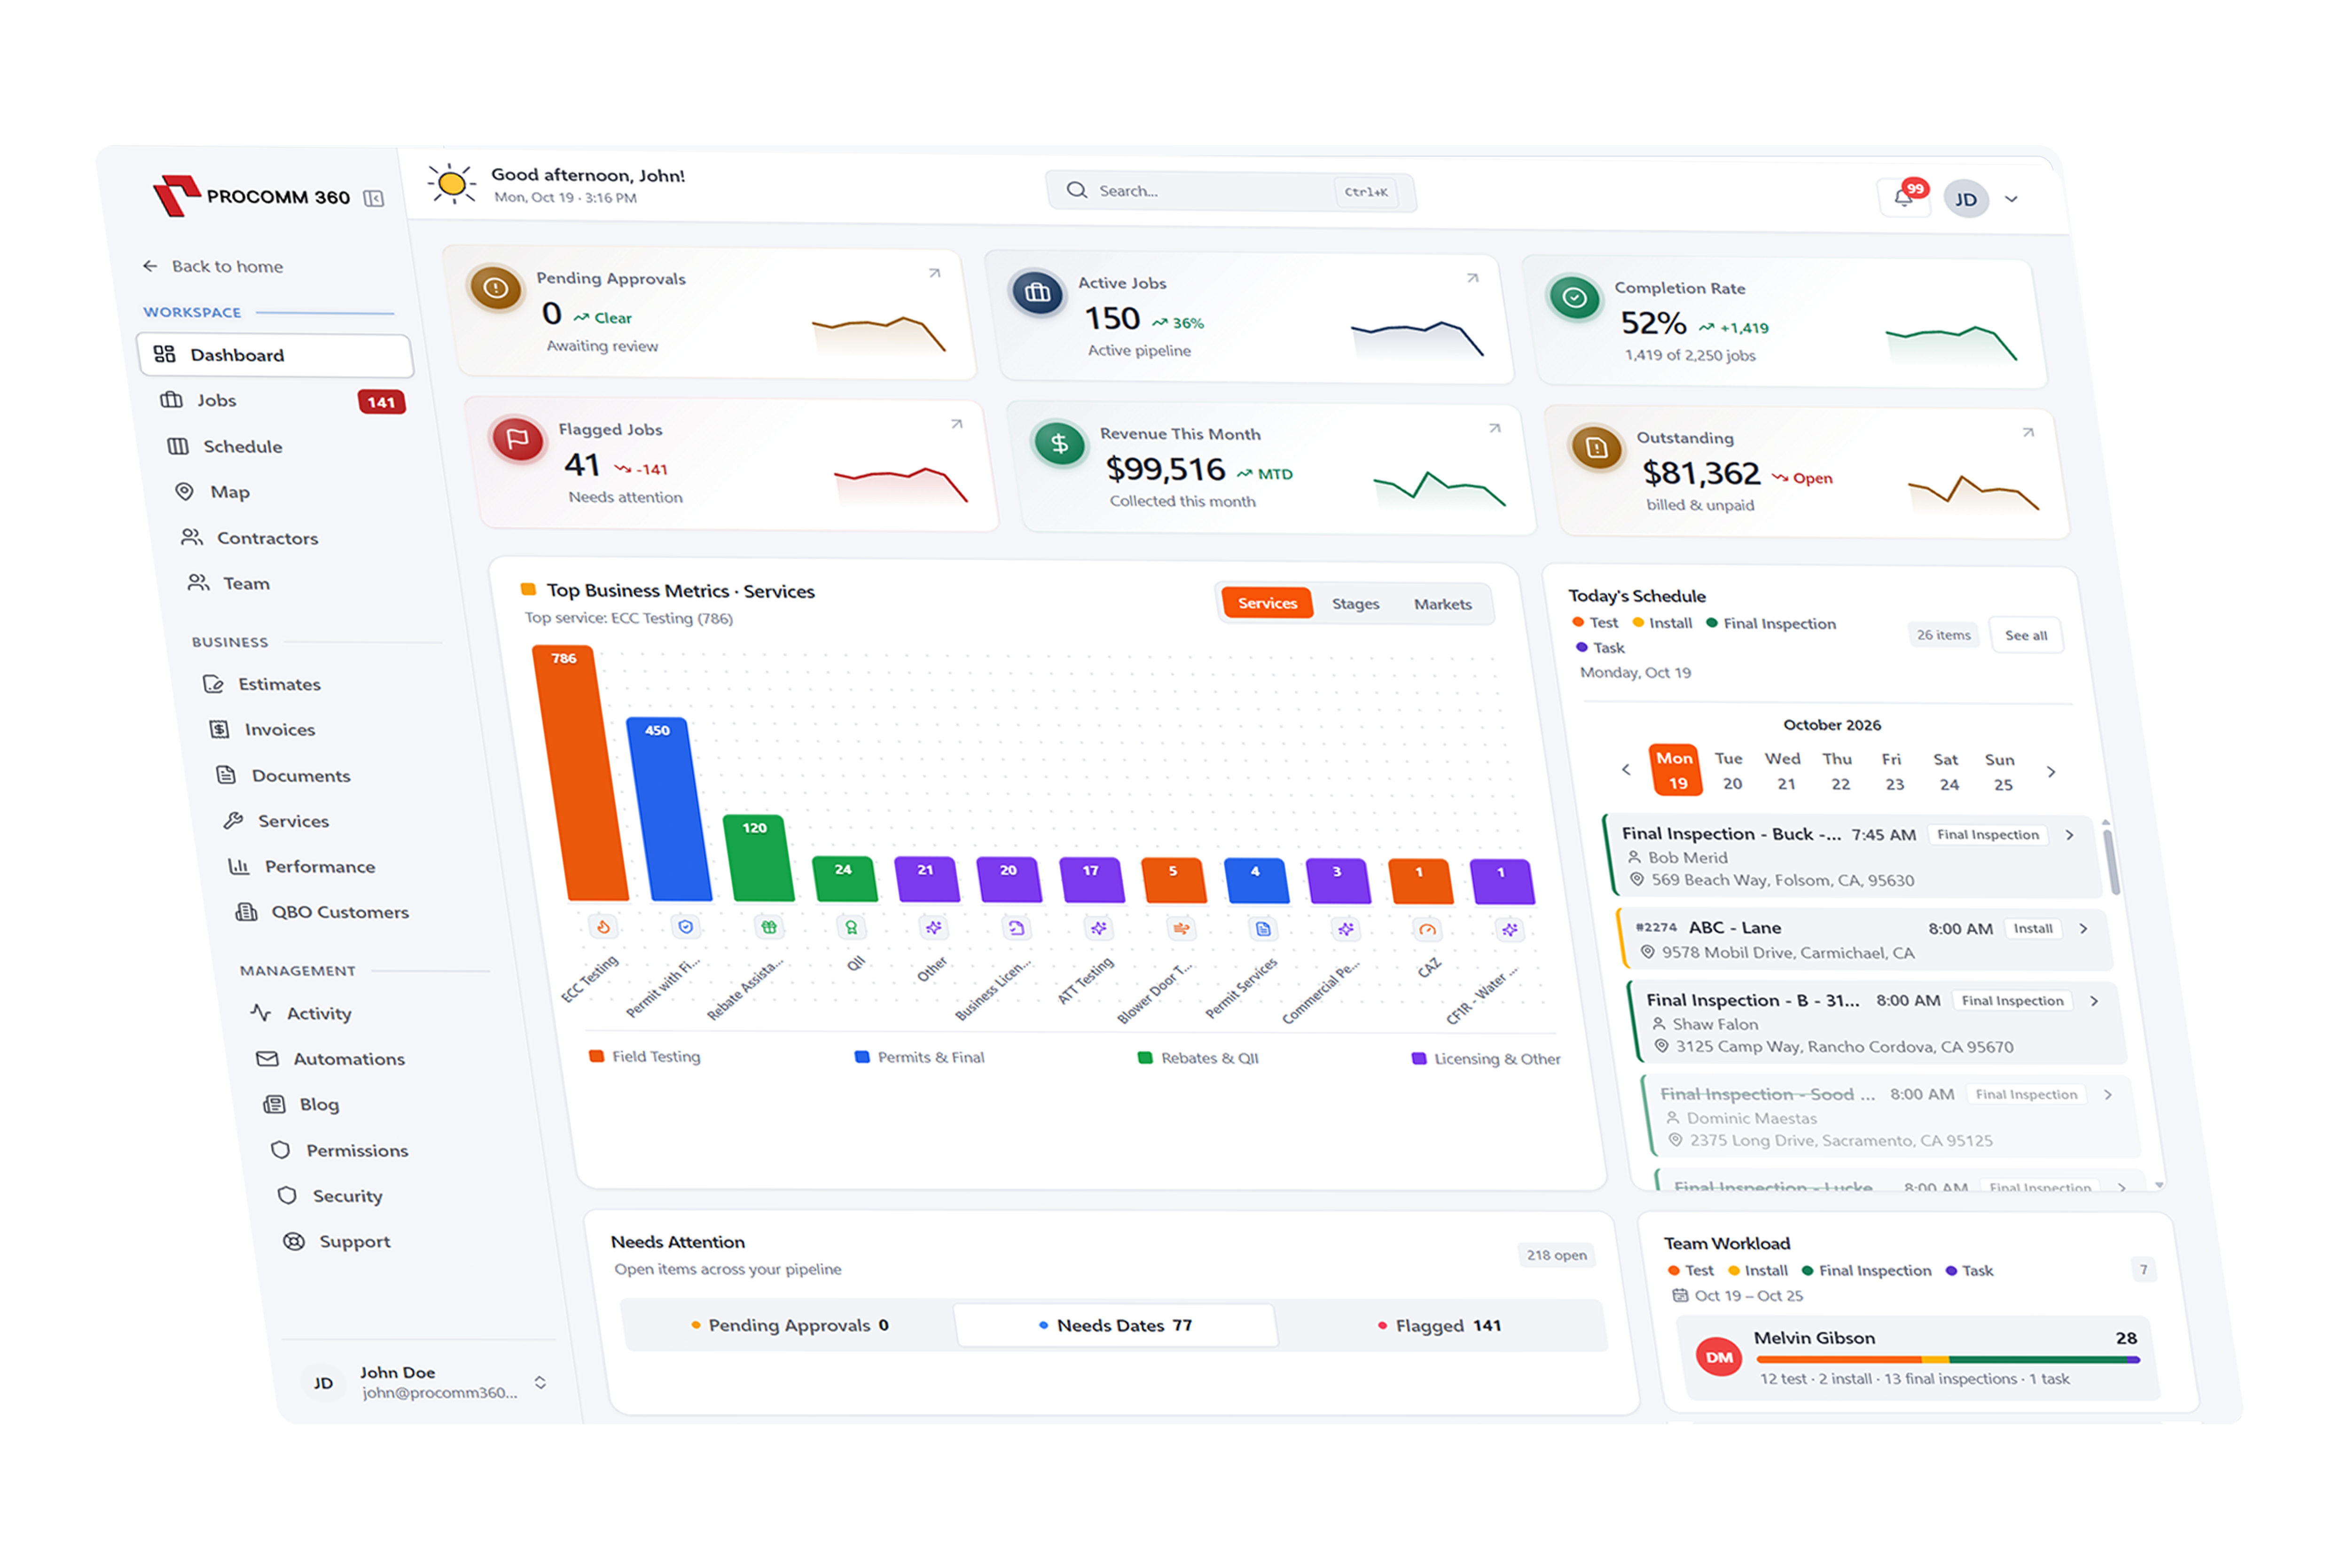
Visualize your data at a glance.
Spot your highest-margin services, best referral sources, and top-performing technicians on one visual command center.
Back to All Systems & FeaturesSystem 03 of 06 · Data Visualization
01 · Capability
Quote-to-Close Funnel Charts
See how many estimates convert into booked jobs, average ticket size by service type, and where leads drop off.
02 · Capability
Crew Utilization & Route Efficiency
Visualize billable hours vs. windshield time across every truck and technician to pack more billable work into every week.
03 · Capability
Marketing & Review Attribution
Track which Google searches, websites, email campaigns, and customer referrals generate the highest revenue.